Port Moresby: land change, 2015–2025
Two Sentinel-2 satellite images of a 20 km square around Port Moresby, from 2015-11-24 and 2025-01-25, were classified by a ResNet18 model trained on EuroSAT. Every 640 m cell is put in one of four land-cover groups, and the two dates are compared cell by cell.
- Before
- 2015-11-24
- After
- 2025-01-25
- Area analysed
- 394 km²
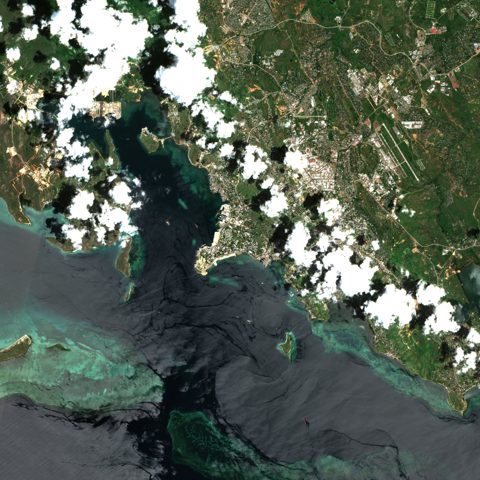
Change
+45.3 km²net change in built-up area
In cells the model is sure of on both dates (confidence ≥ 0.8): 16.4 km² became built-up, 77 km² changed in total.
The two images are from different seasons. Seasonal differences can look like change; pick the same month for a more reliable result.
Part of the image is cloudy or missing; results are unreliable there.
Prior knowledge (Natural Earth): 129 cells in open water well away from the shore were counted as water; the model had seen another class there.
Land cover on both dates
| 2015 | 2025 | ± | |
|---|---|---|---|
| Agriculture decreased | 11.1% | 4.5% | -6.6 |
| Natural vegetation decreased | 44.4% | 26.2% | -18.2 |
| Built-up increased | 10.8% | 22.3% | +11.5 |
| Water increased | 33.6% | 47% | +13.4 |
Largest transitions (confident cells)
- Natural vegetation → Water43.4 km²
- Natural vegetation → Built-up11.1 km²
- Agriculture → Natural vegetation7.4 km²
- Natural vegetation → Agriculture4.9 km²
- Agriculture → Built-up4.5 km²
Limits
- Every value shown is a model estimate, not a measurement.
- Areas are not measurements but approximations counted from cells. The figures are always computed on 640 m cells; the scale only changes how the map is drawn.
- The model was trained on European images only; results for places tagged "experimental" are less reliable.
- Clouds, shadows and seasonal differences can show change that is not there.