Addis Ababa: land change, 2016–2025
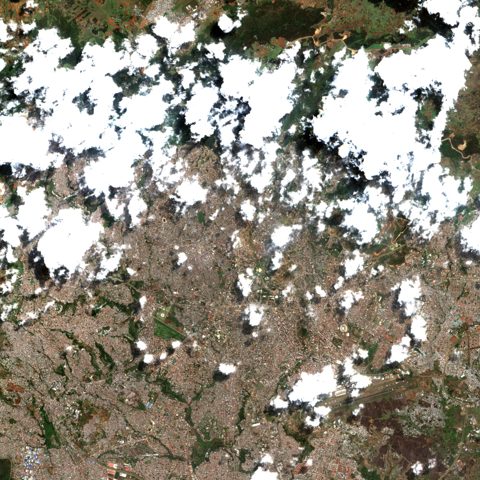
Two Sentinel-2 satellite images of a 20 km square around Addis Ababa, from 2016-08-22 and 2025-06-16, were classified by a ResNet18 model trained on EuroSAT. Every 640 m cell is put in one of four land-cover groups, and the two dates are compared cell by cell.
- Before
- 2016-08-22
- After
- 2025-06-16
- Area analysed
- 394 km²
Change
+58.3 km²net change in built-up area
In cells the model is sure of on both dates (confidence ≥ 0.8): 39.7 km² became built-up, 83.2 km² changed in total.
The two images are from different seasons. Seasonal differences can look like change; pick the same month for a more reliable result.
Part of the image is cloudy or missing; results are unreliable there.
This area lies in the Ethiopian Highlands mountain region. Bare rock and scree have no class of their own in EuroSAT and can show up as built-up or agriculture.
Land cover on both dates
| 2016 | 2025 | ± | |
|---|---|---|---|
| Agriculture decreased | 25.5% | 11.3% | -14.2 |
| Natural vegetation no notable change | 35.7% | 35.1% | -0.6 |
| Built-up increased | 38.8% | 53.6% | +14.8 |
| Water no notable change | 0% | 0% | 0 |
Largest transitions (confident cells)
- Agriculture → Natural vegetation21.7 km²
- Agriculture → Built-up20.5 km²
- Natural vegetation → Built-up19.3 km²
- Built-up → Natural vegetation10.2 km²
- Natural vegetation → Agriculture7.4 km²
Limits
- Every value shown is a model estimate, not a measurement.
- Areas are not measurements but approximations counted from cells. The figures are always computed on 640 m cells; the scale only changes how the map is drawn.
- The model was trained on European images only; results for places tagged "experimental" are less reliable.
- Clouds, shadows and seasonal differences can show change that is not there.